Grafana dashboards
The provisioned Grafana dashboards and what they show.
Grafana dashboards
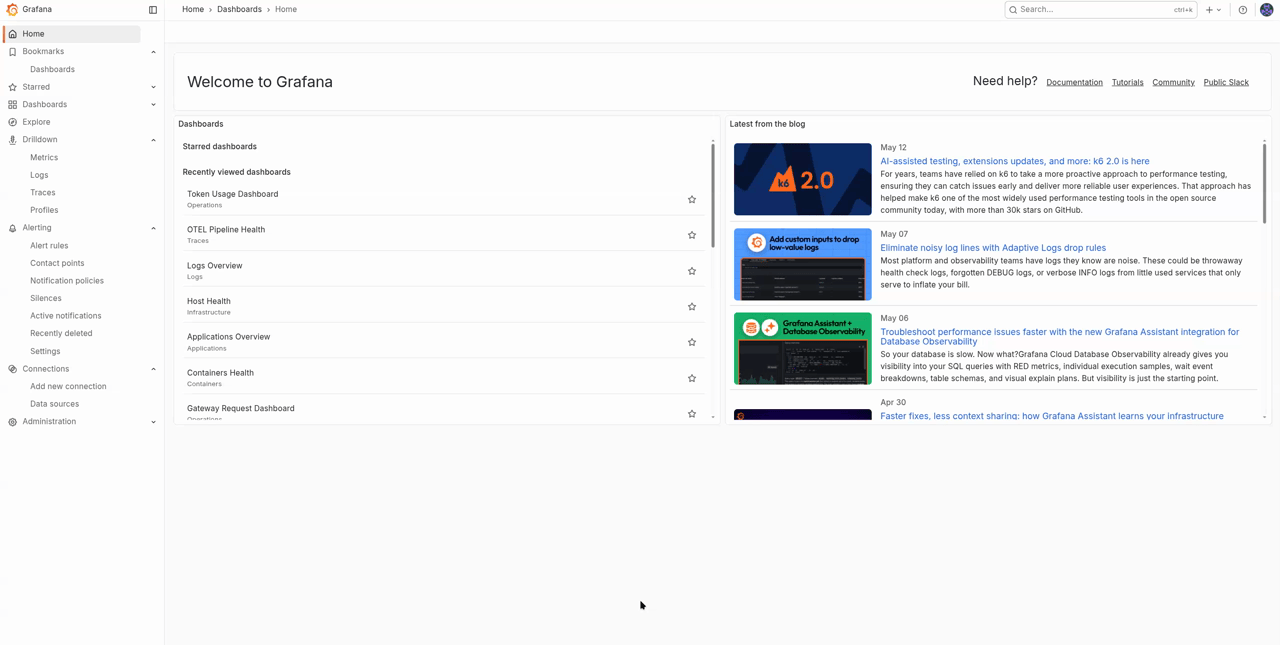
Grafana is the main investigation surface of the LGTM stack. It is provisioned automatically when the observability profile is enabled.
Depending on your role, you may see the full workspace or only a subset of folders. Organisation users often get read-only access to the dashboards relevant to their deployment. Platform operators usually see all folders, data sources, and alerting controls.
Default URL: http://127.0.0.1:3001
Default user: admin
Password source: GRAFANA_ADMIN_PASSWORD
Folders
| Folder | Audience | What it contains |
|---|---|---|
| Infrastructure | Platform operators | Host CPU, memory, disk, and node-level health from node-exporter |
| Containers | Platform operators | Per-container health from cAdvisor |
| Applications | Platform operators | Shared application-level views across services |
| Operations | Organisation users with stack access, SRE | Gateway-specific dashboards for requests, providers, safety, plugins, budgets, cache, and logger health |
| Organizations | Platform operators, some enterprise users | Tenant comparison across organisations on the same deployment |
| Logs | Investigation users, platform operators | Loki-backed log dashboards and Explore entry points |
| Traces | Investigation users, platform operators | Tempo overview and OTel pipeline health |
Operations Folder
The Operations folder is the first place most Odock investigations begin.
| Dashboard | Purpose |
|---|---|
| Gateway Request Dashboard | Request volume, status mix, p50/p95/p99 latency, and streaming sessions |
| Provider Dashboard | Per-provider request rate, error rate, and latency |
| Rate Limit Dashboard | Rate-limit decisions, rejections, and stage-level behavior |
| Backend Safety Dashboard | SafetySec module runs, blocks, redactions, and decisions |
| Token Usage Dashboard | Token throughput by provider, model, organisation, and key |
| Usage / Budget Dashboard | Budget reservation, settlement, and decision counters |
| Cache Revalidation Dashboard | Cache invalidate traffic and Redis publish or consume behavior |
| Logger Health Dashboard | Log enqueue, drop, write error, batch size, queue depth, and flush duration |
Traces Folder
| Dashboard | Purpose |
|---|---|
| Traces Overview | Cross-service trace shape, error spans, and slow endpoints |
| OTel Pipeline Health | Collector exporter success and failure rates plus queue health |
Organizations Folder
| Dashboard | Purpose |
|---|---|
| Organizations Overview | Per-organisation traffic, token, and cost comparison |
Some deployments may hide this folder from organisation users when it exposes tenant-wide comparisons they should not see.
How Dashboards Connect To The Rest
The key workflow is symptom to evidence:
- spot an anomaly in a metrics dashboard
- jump to a trace or a filtered log view
- correlate the result with the matching usage record
Tips
Open the Gateway Request Dashboard and the Provider Dashboard first when a user reports a production issue. Together they usually tell you whether the problem is gateway-side, provider-side, or isolated to one workload.
Dashboard JSON files are provisioned from observability/grafana/dashboards/. UI edits should be exported back to the file set or they will be lost on restart.