Record details
The single-pane view of one gateway request.
Record details
Clicking a row in the Usage Records table opens the detail page for that request. It is the single-pane view of one call — header fields at the top, a routing section, and breakdown cards below.
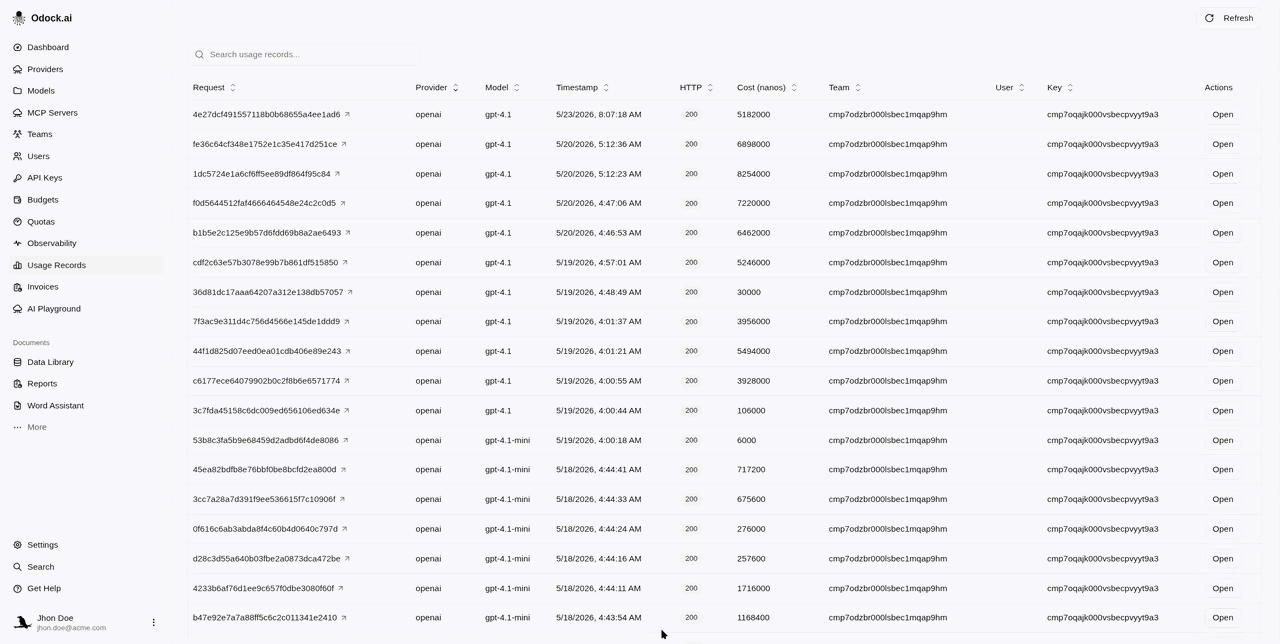
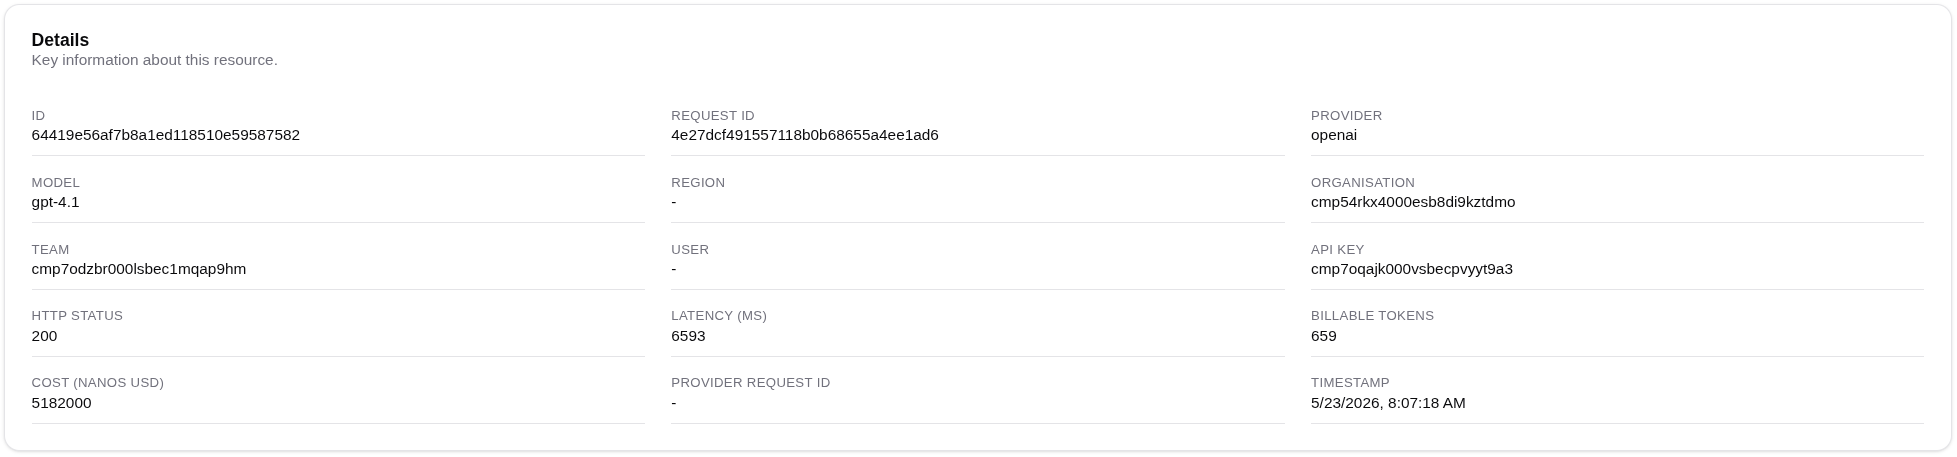
Header
The top of the page is a read-only grid of the most useful fields:
| Field | Use it for |
|---|---|
| Request ID | Correlating with your application logs and support tickets. |
| Provider / Model | Confirming which target served the call. |
| HTTP Status | The final outcome returned to your application. |
| Latency | Total wall-clock duration. |
| Billable tokens / Cost | What you were charged. |
| Provider Request ID | The id assigned by the upstream provider — useful when filing a ticket with the provider. |
| API Key / Team / User | The principal that signed the request. |
| Timestamp | When the call completed. |
Routing Section
If smart routing is enabled, a card shows the attempt chain in the order it ran:
- a Direct badge when the originally requested target served the call,
- a Rerouted badge when a fallback took over,
- one row per attempt with the provider, the model, the outcome (success, failed), and the error string for failed attempts.
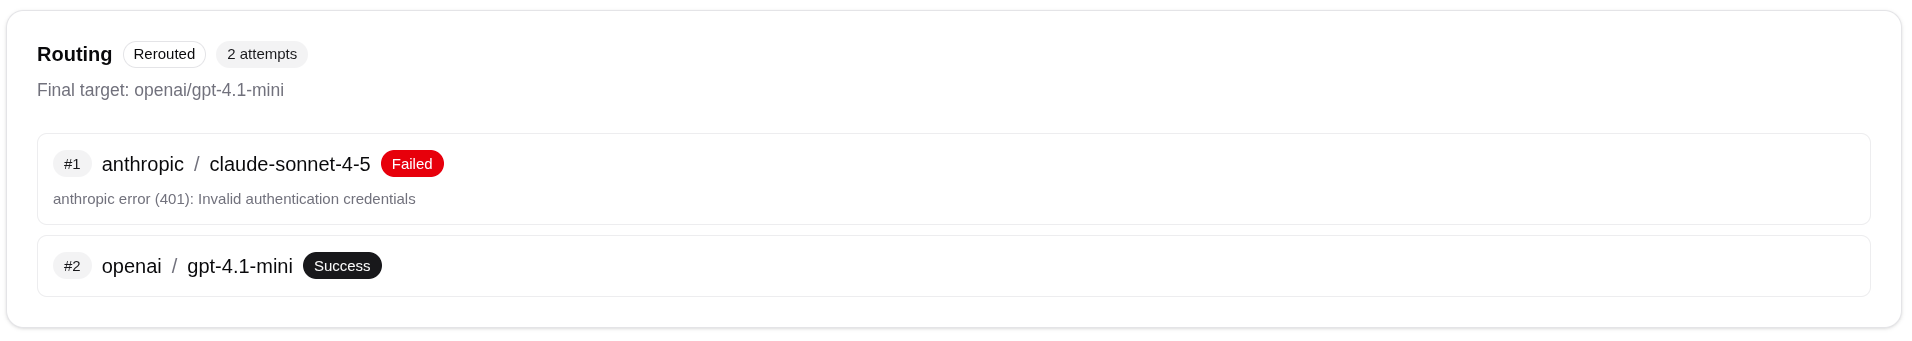
The provider and model in the header always reflect the attempt that actually answered. When the card says Rerouted, the original target is in the attempt chain, not the header.
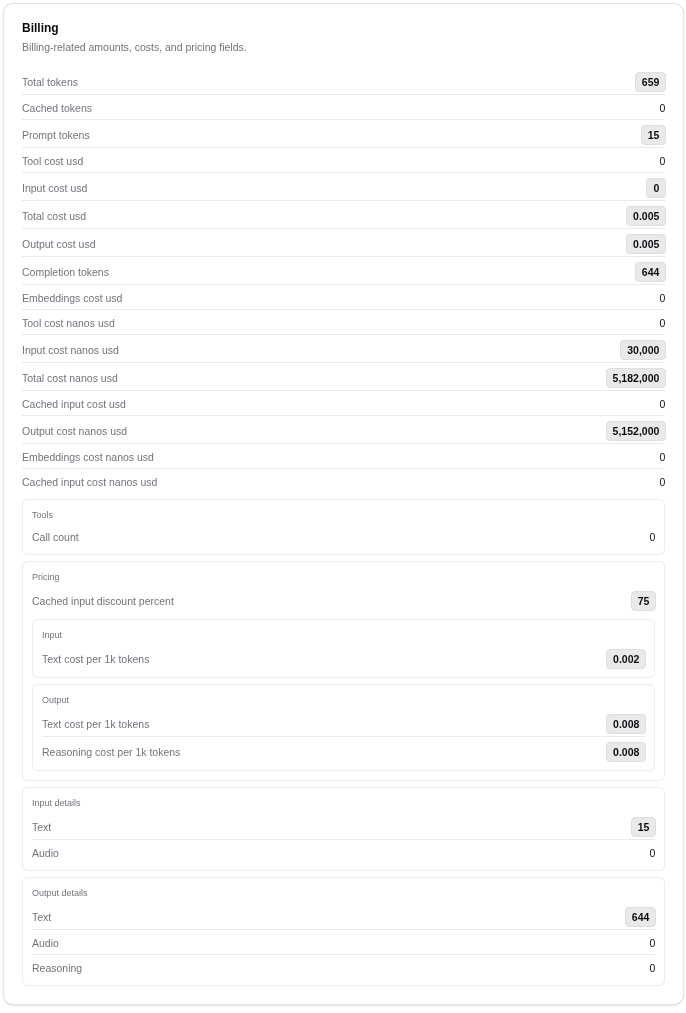
Breakdown Cards
Below the routing section, breakdown cards render the structured payloads attached to the record:
| Card | What it shows |
|---|---|
| Billing | The cost breakdown the calculator produced, with per-token-class amounts, cache discounts when applicable, and per-unit costs (units_cost_usd) for endpoints billed per unit. |
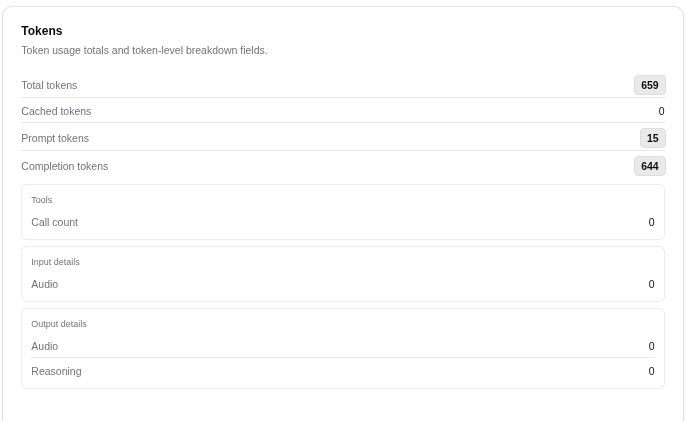
| Tokens | Normalized totals plus any per-class breakdown returned by the provider (input, output, cached, reasoning, audio, image, tool), and the per-unit quantity (units / unit_kind) for per-unit endpoints. |
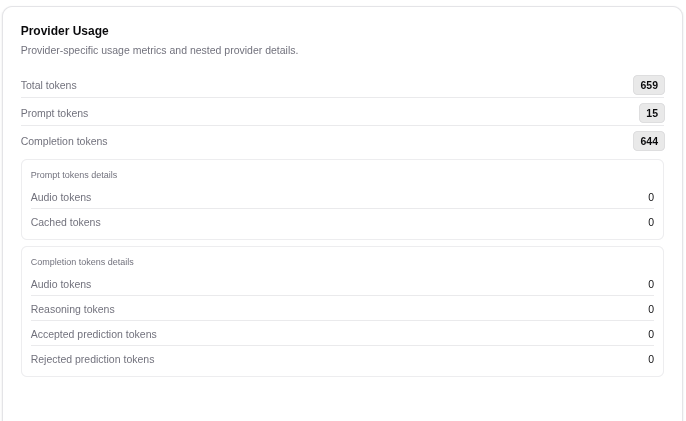
| ProviderUsage | The provider's own usage payload as returned. The same numbers the provider would show in its console. |
| Routing | The routing payload in raw form. The card above this is the structured view of the same data. |
| Metadata | Gateway traceability — plugin executions and durations, safety decisions, and rate-limit stage outcomes. |
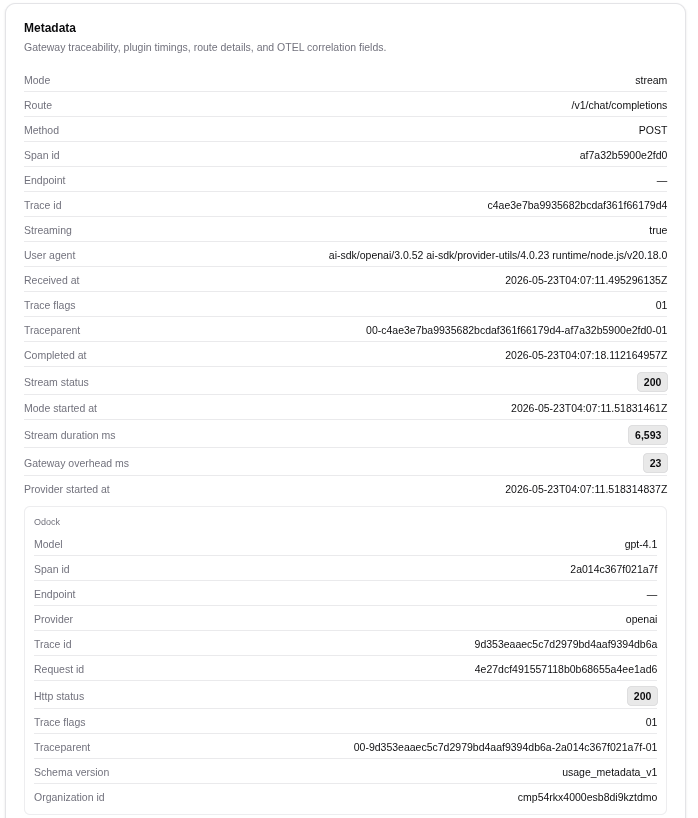
Each card hides itself when it has nothing to show. A call that failed at auth, for example, has no token, billing, or routing data, so only the metadata card will appear.
Per-unit usage (e.g. OCR pages)
Some endpoints are billed per unit rather than per token. For these, the Tokens card shows a generic units quantity with a unit_kind label describing what one unit is, and the Billing card reports the matching units_cost_usd / units_cost_nanos_usd separately from token and embeddings costs.
For example, a Mistral OCR call records the page count under units with unit_kind: "pages", while the underlying provider count (pages_processed) stays visible in the ProviderUsage card for reconciliation. The header's Billable tokens / Cost still reflects the full charge — the per-unit cost is already included in the total. See Model Pricing for how the per-unit rate is configured.
Typical Investigation
| You are debugging... | Open... |
|---|---|
| A user-reported slow call | The Routing section and the Metadata card. Plugin durations there often explain a regression. |
| A 4xx your user did not expect | The Metadata card. It records which gate denied the request. |
| A cost that looks wrong | The Billing and Tokens cards. |
| A provider-side issue | The Provider Request ID in the header — pass it to provider support. |
Tips
Copy the Request ID when filing an internal ticket. It is the single id that ties together the persisted record, your application logs, and any platform-side trace.