MCP usage records
How MCP tool calls appear in Usage Records.
MCP usage records
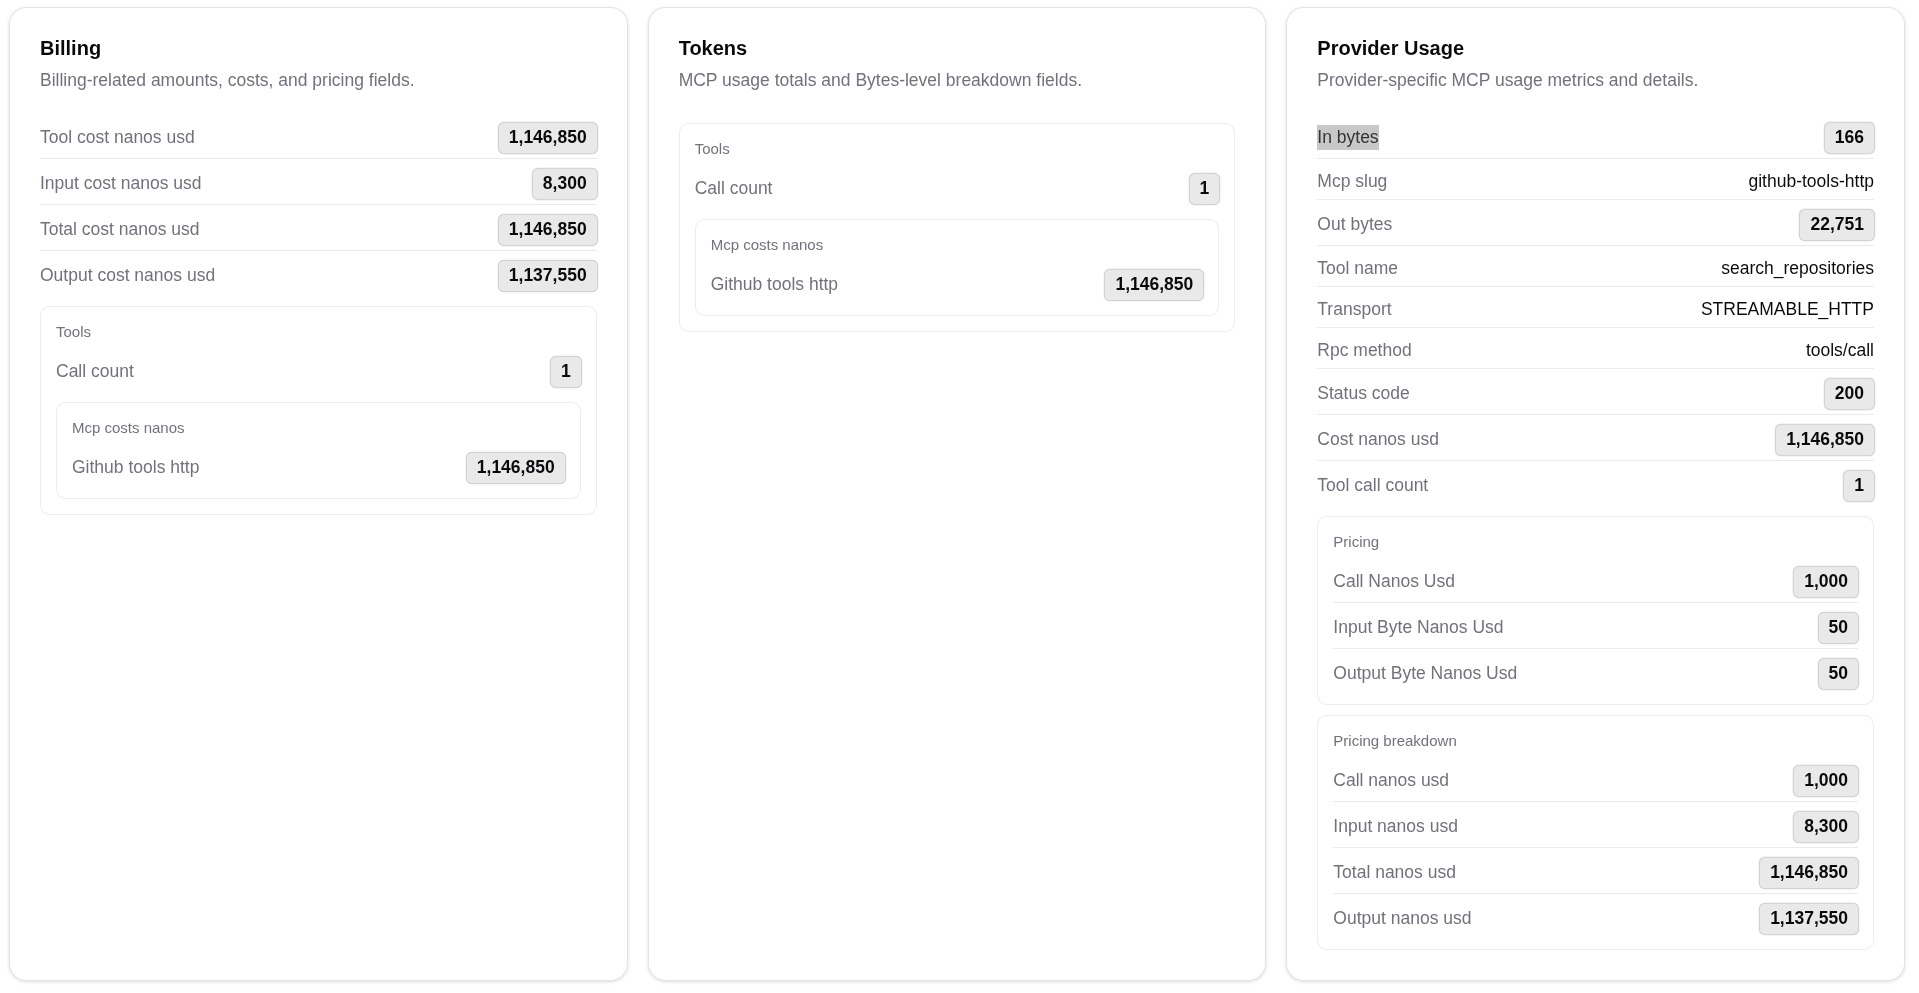
MCP calls produce a usage record alongside LLM calls. They appear in the same table, listed with provider = mcp. The detail page is the same shape as for an LLM record, with the cards adjusted for MCP context.
What Is Extra For MCP
A paired MCP record stores the tool-level surface:
| Field | Reads |
|---|---|
| MCP Server | The MCP server the request was routed to. |
| Tool | The tool invoked by the call. |
| RPC Method | The JSON-RPC method — for example tools/call, tools/list. |
| Transport | The active transport: HTTP, SSE, or STDIO. |
| Tool call count | How many tool calls the request executed. A single MCP request can run more than one. |
| Bytes | Request and response payload sizes. MCP usage is measured in bytes, not tokens. |
The Tokens card on an MCP record is labelled to reflect bytes rather than tokens.
Finding MCP Calls
Open Usage Records.
Set the Provider filter to mcp.
Filter by Date range or API Key as needed.
Click a row to open the detail page.
For tool-level trends across the organisation, the Traffic Analytics page MCP tab groups records by server and tool.
Tips
The Cost column on an MCP row is the unified figure for budgets and quotas. The MCP-specific cost contribution shown inside the breakdown is included in that total — do not sum both.